Summary#
This extension is about simplifying a causal map by keeping only the most frequently mentioned:
- links (really: bundles of co-terminal links, i.e. repeated claims with the same cause and effect), and/or
- factors (the most mentioned concepts/themes).
It is best thought of as:
- a filter (a selection rule applied to derived counts), plus
- an interpretation rule (what “frequency” means and what it does not mean).
Core parameters (plain language)#
Both the link-frequency and factor-frequency versions share the same conceptual parameters:
- Mode:
- Minimum: keep everything with count at least the threshold you set
- Top N: keep the N highest-count items
- Count unit:
- Citations: count coded link rows (sensitive to verbose sources)
- Sources: count distinct sources (each source contributes at most 1 to an item)
- Tie rule (important for Top N):
- selection typically respects ties at the cutoff: if the Nth and (N+1)th items have the same count, you either keep all items at that count or none (to avoid arbitrary chopping).
Link frequency (keep the most frequent relationships)#
What the filter operates on#
Strictly, this operates on link bundles, not raw individual coded claims.
Start from the current links table (one row per coded claim), then bundle rows that share the same cause and effect labels.
For each bundle we compute at least:
- citation_count: number of underlying link rows in the bundle
- source_count: number of distinct sources contributing at least one row to the bundle
Then the filter keeps only those bundles meeting the frequency rule (Minimum ≥ k or Top N, using Sources or Citations).
Interpretation rule (“what a link means”)#
On a map, we often say “link” but we mean:
the bundle representing “many similar claims that one factor influences another”.
So “this is a frequent link” means “this cause→effect pairing is frequently claimed”, not “the effect size is large”.
Factor frequency (keep the most frequent concepts)#
What the filter operates on#
Factor frequency is derived from the links table by first computing a factors table (one row per factor label), with counts such as:
- citation_count: how many times the label appears as a cause or effect across coded claims
- source_count: how many distinct sources mention the label at least once
The factor-frequency rule (Minimum or Top N, using Sources or Citations) selects a set of “kept” factors.
How this simplifies the map#
Once you select the “kept” factors, you simplify the map by keeping only the links whose endpoints are both in that kept set. (In network terms, you are looking at the subgraph induced by the most frequent factors.)
This usually has a nice property: it removes “long tail” concepts while preserving the main structure of the story-space.
What frequency is (and is not)#
- Frequency is a measure of evidence volume / breadth:
- citations ≈ how much is said (including repeated mentions)
- sources ≈ how widely something is shared across participants/documents
- Frequency is not a measure of causal effect size, nor of truth.
- Any frequency-based simplification is therefore a pragmatic reading strategy: it prioritises what is most commonly claimed so you can interpret a complex map without being overwhelmed.
Examples (contrasts) from the app#
Link frequency (keep the most frequent relationships)#
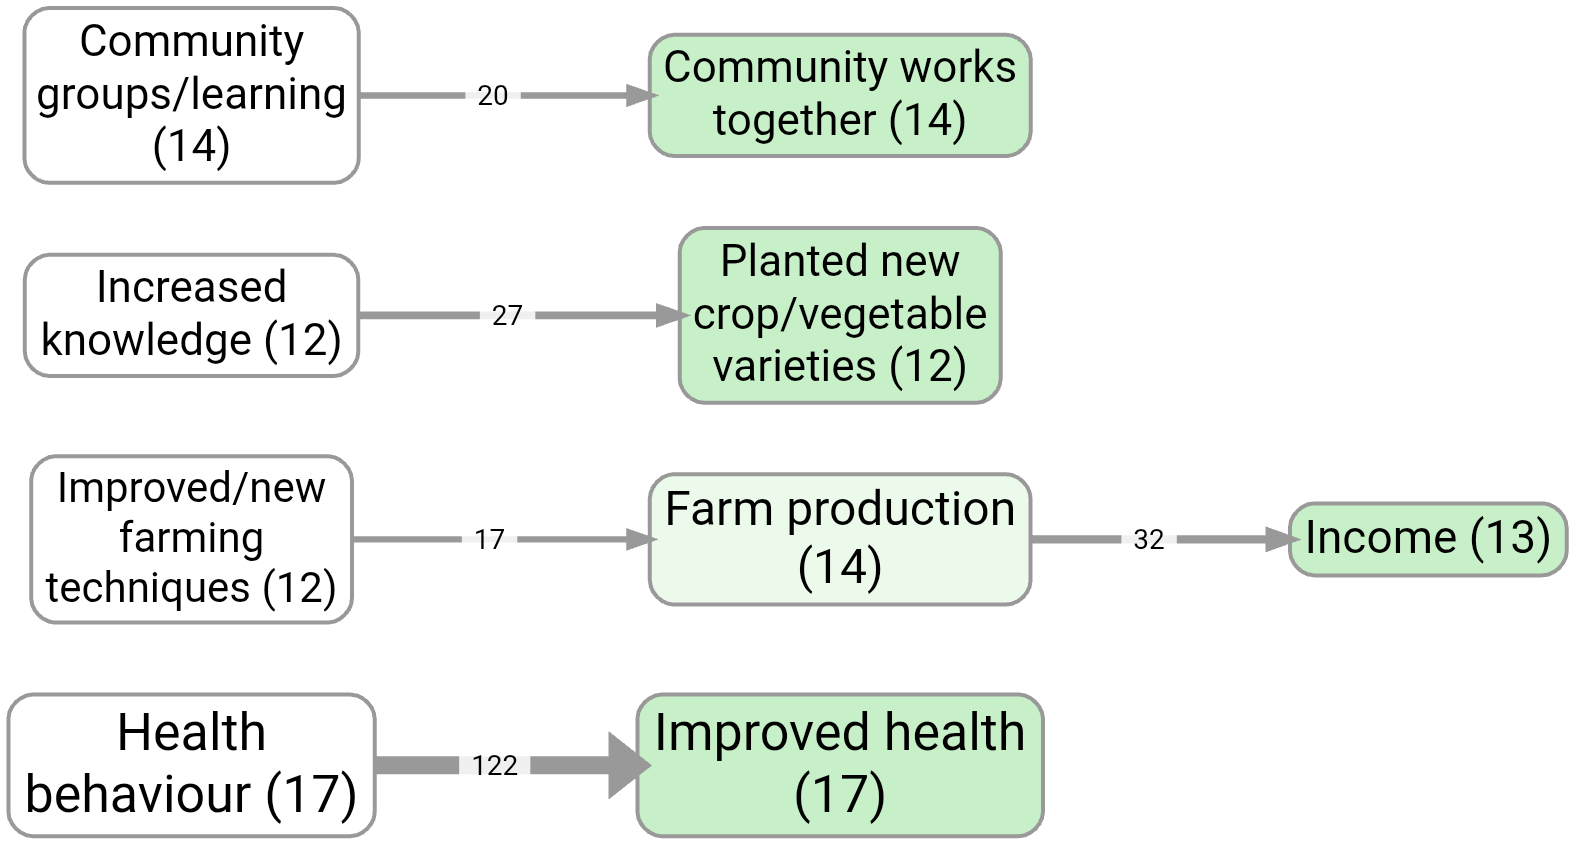
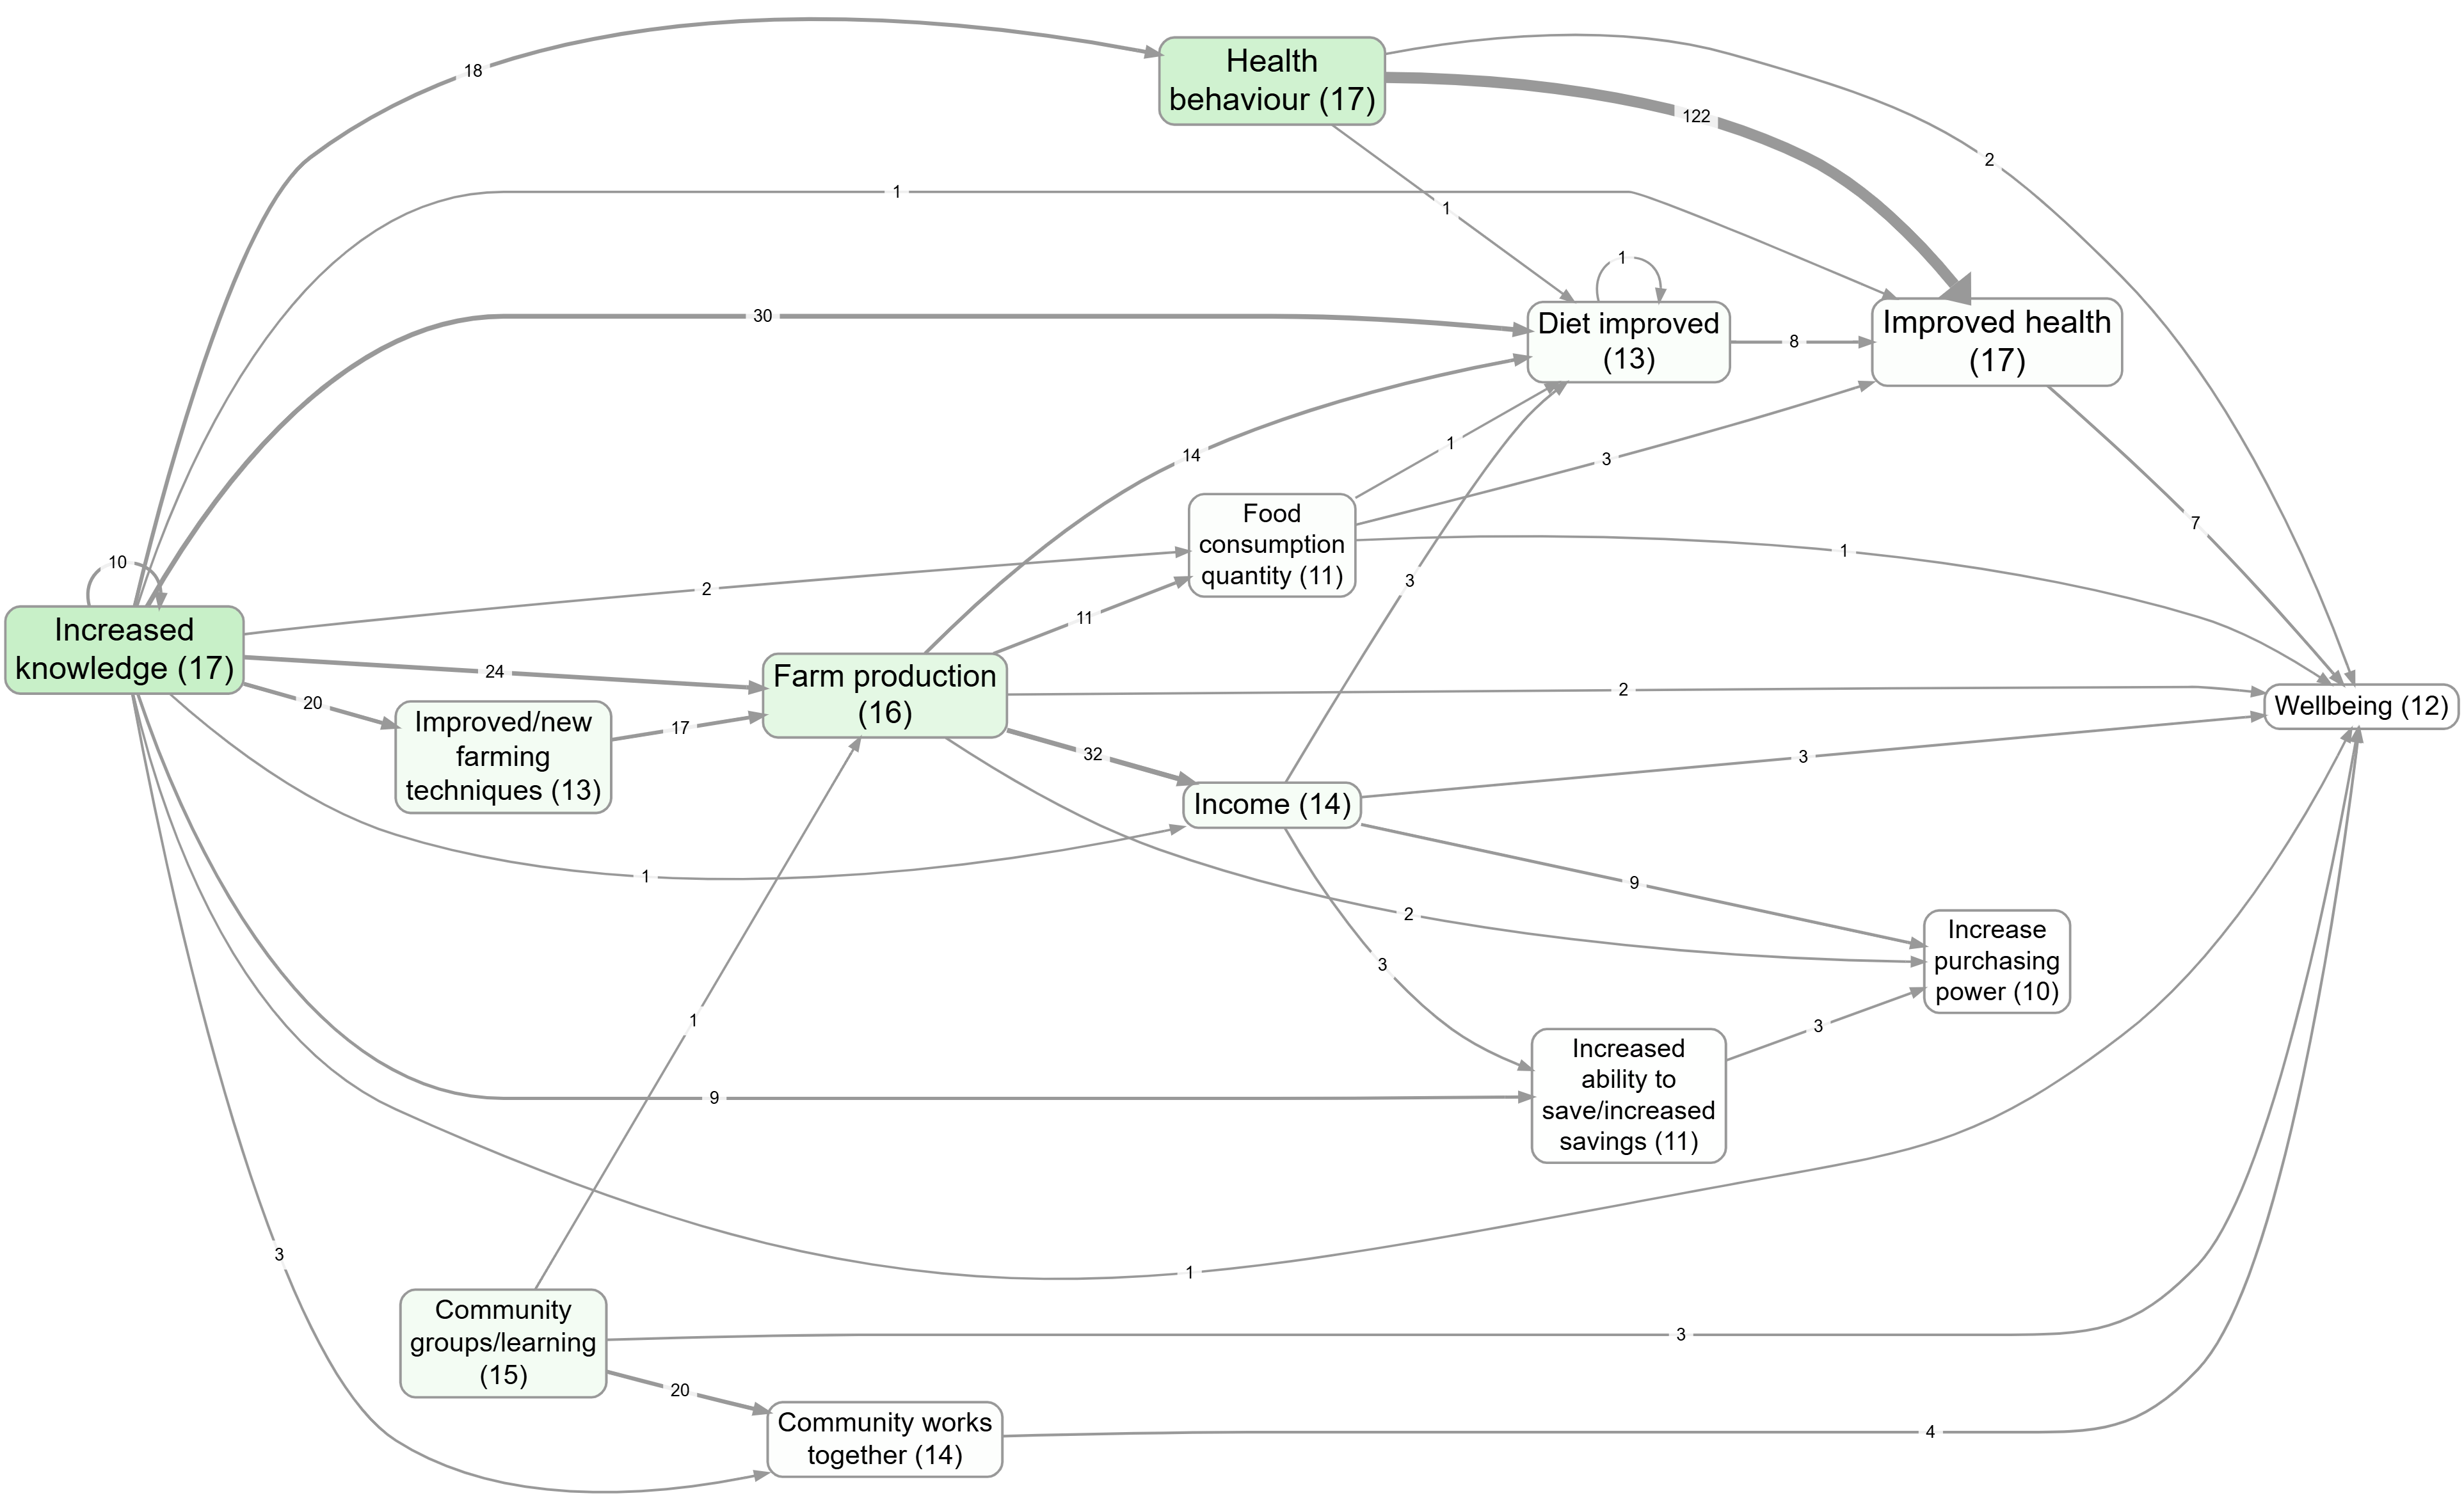
Bookmark #1124 shows a “main links” map created by keeping only the most frequent link bundles (cause→effect pairs).
Factor frequency (keep the most frequent concepts)#
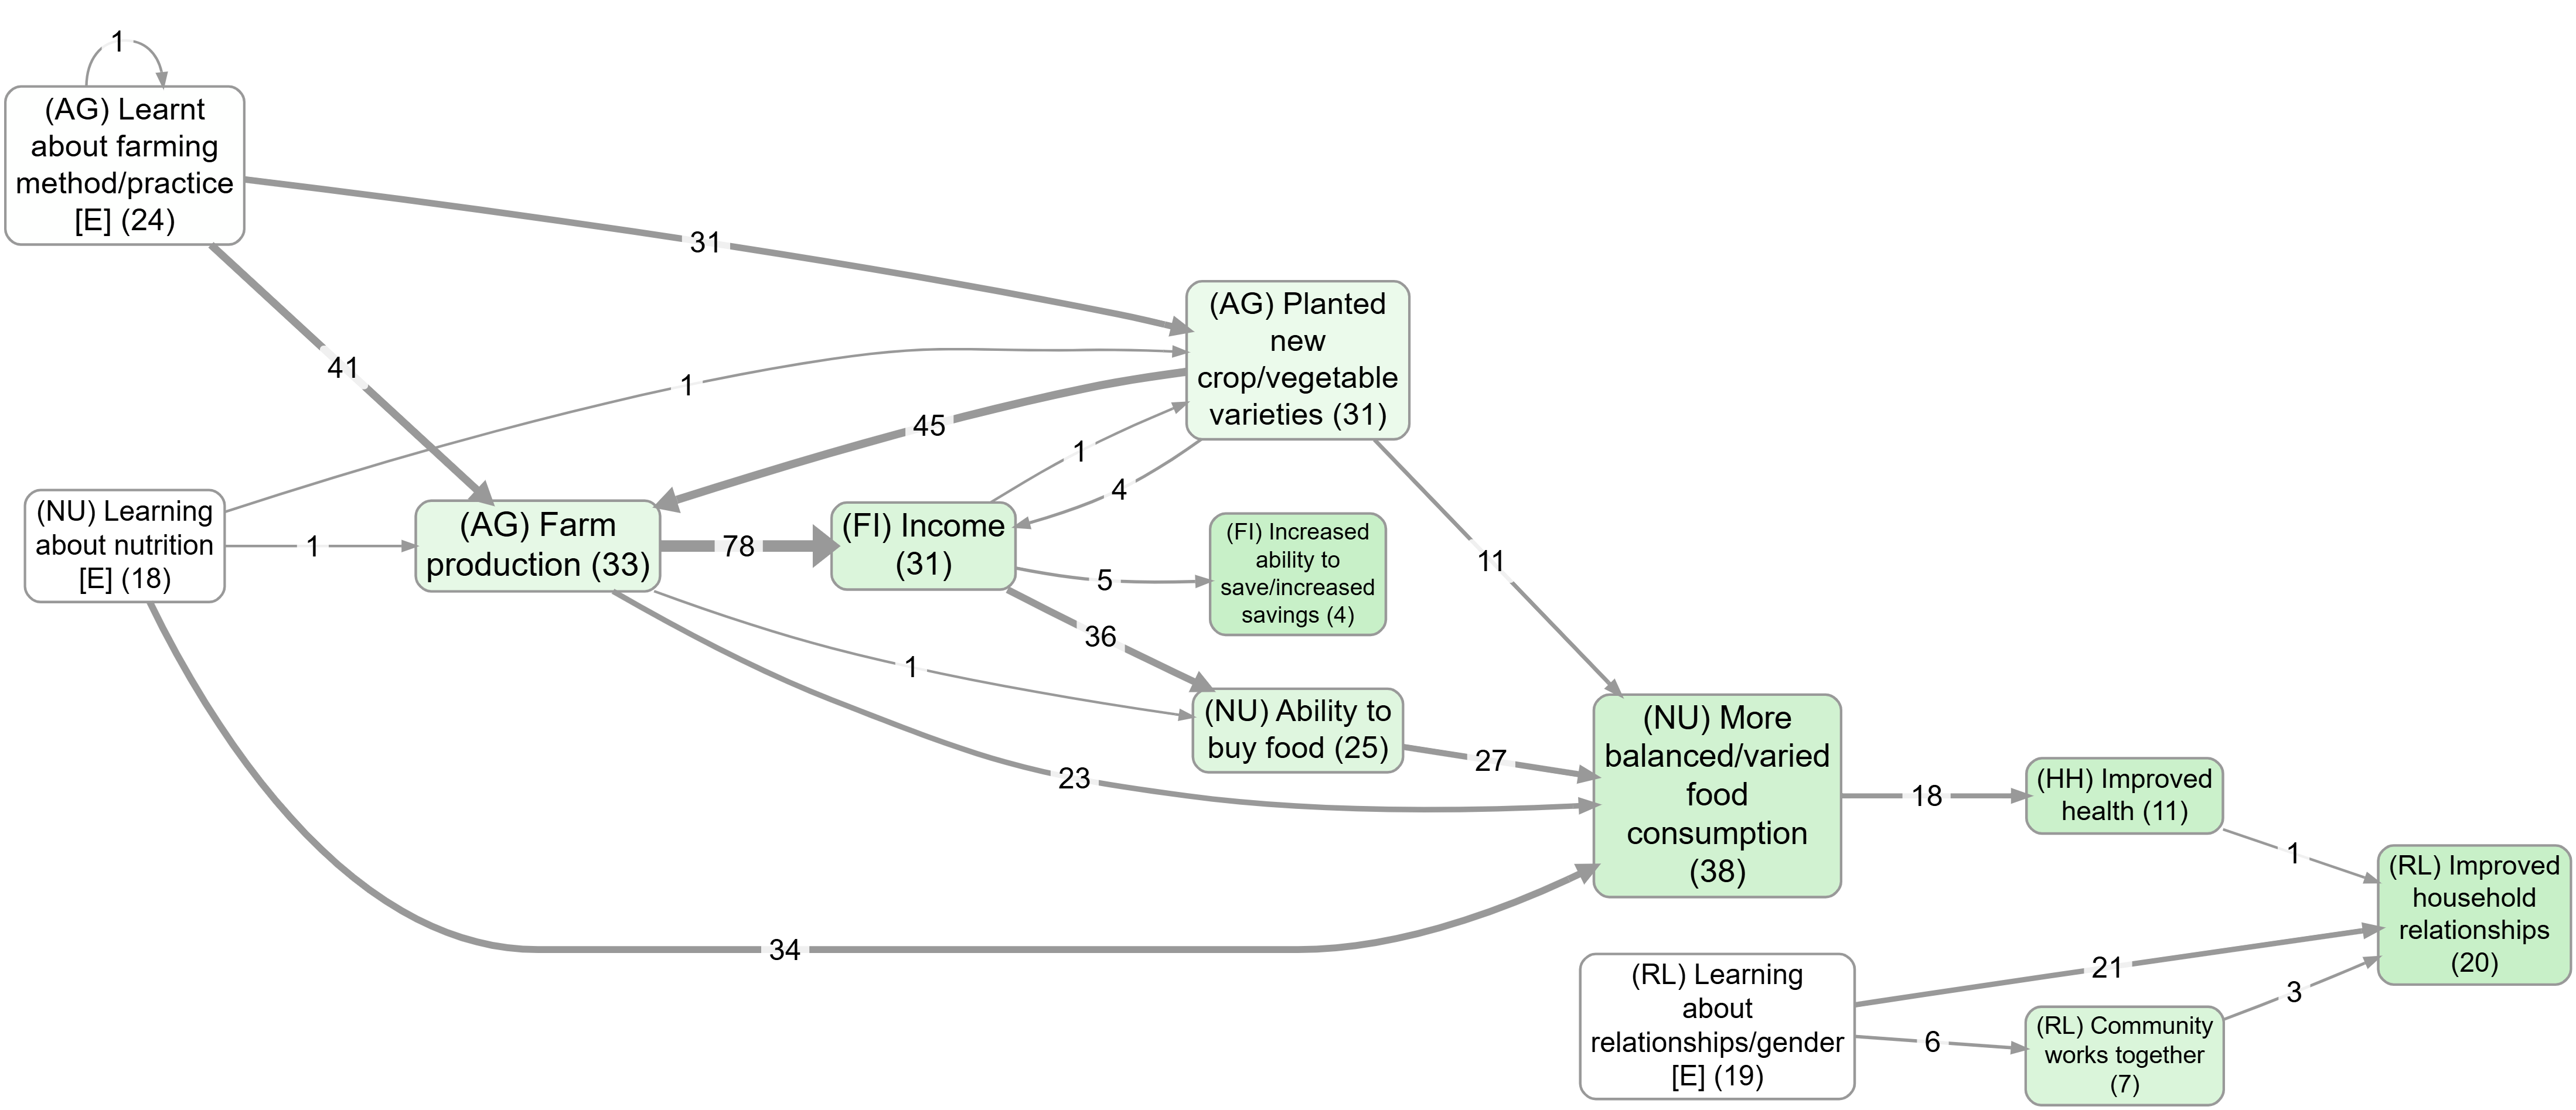
Bookmark #266 shows a “main factors” map created by keeping only the most frequent factors.
A useful contrast: top factors with vs without zoom#
These two views use the same “top factors” idea but differ in granularity because zooming rewrites hierarchical labels to a higher level:
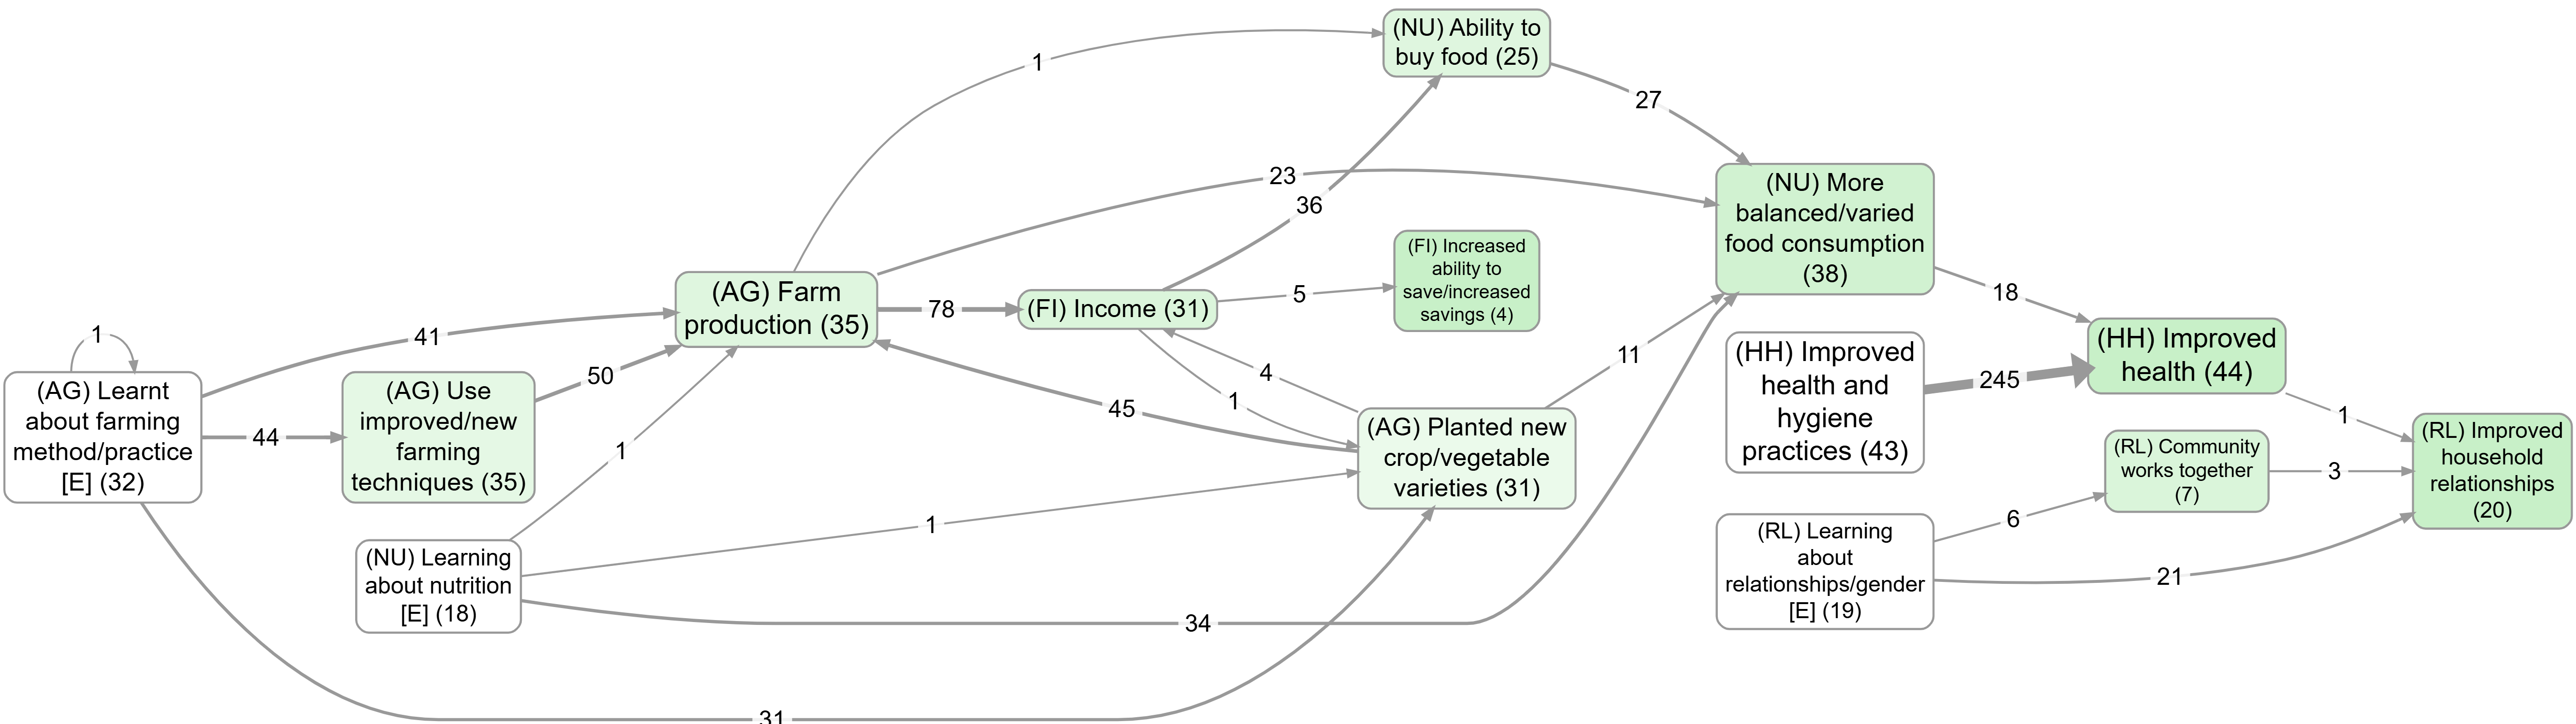
After simplification: reading “importance” (not just frequency)#
Frequency tells you what is mentioned most often. A complementary reading is: which factors are influential in the network (e.g. they influence many factors which are themselves influential)?
Bookmark #1063 shows “importance” colouring after simplifying.
Formal notes (optional)#
- In Top N mode, selection often respects ties at the cutoff: if the Nth and (N+1)th items have the same count, keep all items at that count (or none), rather than chopping arbitrarily.
- Link-frequency bundling can be defined formally by grouping on (cause label, effect label) and computing
source_countandcitation_countper group.
Transformation and interpretation rules#
Transformation rule#
- Input: a links table plus frequency settings (mode:
MinimumorTop N; count unit:CitationsorSources). - Transformation: either (a) bundle links and rank/filter bundles by frequency, or (b) derive factor frequencies and keep only links between kept factors.
- Output: a simplified links table/map with fewer displayed links and/or factors.
Interpretation rule#
- Frequency means reported volume or breadth (
CitationsvsSources). - It helps simplify and orient analysis, but does not measure causal strength or truth.
See also#
- Formatting your map for what you want to show for how this filter sits in a real workflow.